CMBS Analysis: Key Metrics Structured Credit Investors Track
CMBS analysis follows the path of credit risk from the underlying commercial real estate loan to the bond itself. Investors first assess whether a property's income and value are sufficient to support its debt and whether there is potential for loan losses. Then they evaluate how the securitization distributes those potential losses across the capital structure. Finally, they determine whether the bond's price and interest rate adequately compensate the investor for the remaining risk.
This guide explains the key metrics institutional investors use throughout that process. It covers how loans are sized, how property performance is monitored after issuance, how deal structure influences credit risk, how refinancing capacity shapes outcomes, and how spread and relative value drive investment decisions.
Start With the Structure
Before interpreting any metric, identify the type of CMBS transaction you're analyzing. The same ratio can mean very different things depending on how the underlying loans are grouped together.
Conduit CMBS
Conduit transactions combine dozens or even hundreds of commercial real estate loans into a single security. Because the loans span multiple borrowers, property types, and geographic markets, investors focus on the health of the portfolio as a whole rather than any single property. A weak loan deserves attention, but diversification often limits its impact on the broader transaction.
Single-Asset Single-Borrower (SASB)
SASB transactions are backed by one loan secured by a single property or closely related portfolio. Without diversification, every metric reflects the performance of that one asset. Investors spend more time evaluating tenant quality, lease expirations, local market conditions, and sponsorship because the success of the entire transaction depends on a single source of cash flow.
CRE CLOs
Commercial real estate collateralized loan obligations (CRE CLOs) are backed by shorter-term loans, often financing properties that are being renovated, leased up, or repositioned before they reach stabilized occupancy. Many CRE CLOs also allow managers to replace or add loans during a reinvestment period. As a result, metrics that appear weak today may simply reflect assets that are still executing their business plans rather than properties experiencing long-term credit deterioration.
CMBS Analysis Metrics at a Glance
The benchmarks above provide a starting point rather than definitive pass-or-fail thresholds. Property type, loan vintage, market conditions, and transaction structure all influence how experienced investors interpret each metric.
Sizing and Leverage
Every CMBS analysis begins with the loan itself. Before evaluating bond ratings or market pricing, investors need to determine whether the property's income and value can realistically support the amount of debt being financed. DSCR, LTV, and debt yield each answer that question from a different perspective.
Debt Service Coverage Ratio (DSCR)
Debt service coverage ratio (DSCR) measures whether a property's income is sufficient to cover its scheduled debt payments.
DSCR = Net Cash Flow ÷ Annual Debt Service
How to interpret it
- Below 1.20x: Limited income cushion and greater repayment risk.
- 1.20x to 1.35x: Generally considered acceptable for newly originated conduit loans.
- Above 1.35x: Stronger capacity to absorb declines in income or increases in operating expenses.
A higher DSCR generally indicates greater capacity to withstand vacancies, declining rents, or rising operating expenses. Because it directly measures debt repayment capacity, it is often the first metric investors review. Keep in mind that interest-only loans can overstate repayment capacity by excluding principal payments, so always confirm whether the ratio reflects interest-only or fully amortizing debt service.
Loan-to-Value Ratio (LTV)
Loan-to-value ratio (LTV) compares the outstanding loan balance with the property's current value.
How to calculate it
LTV = Current Loan Balance ÷ Current Property Value
How to interpret it
- Below 55%: Low leverage and substantial value protection.
- 55% to 65%: Strong leverage by today's underwriting standards.
- Above 80%: Limited protection against further declines in property value.
LTV estimates how much collateral protection exists before principal losses occur. Because property values change over time, older appraisals may significantly overstate today's value, making current or stressed LTV more useful than the original underwriting figure.
Debt Yield
Debt yield measures how much income a property generates relative to the size of its loan.
How to calculate it
Debt Yield = Net Operating Income ÷ Loan Amount
How to interpret it
- Below 9%: Greater refinancing and credit risk.
- 9% to 11%: Generally consistent with current lending standards for many property types.
- Above 11%: Strong income relative to the loan balance.
Debt yield is one of the clearest measures of underlying credit quality because it depends only on property income and loan balance. Unlike DSCR or LTV, it cannot be improved through lower interest rates or optimistic appraisals. When reviewing debt yield, confirm whether the calculation uses current income or projected stabilized income, as projected figures can overstate refinancing capacity.
Operating Performance
A loan may be conservatively underwritten at origination, but its risk profile changes as the property operates. These metrics show whether the collateral is performing as expected.
Net Operating Income (NOI) Versus Underwriting
NOI versus underwriting compares current property income with the assumptions used when the loan originated.
How to calculate it
NOI Ratio = Current NOI ÷ Underwritten NOI
How to interpret it
- Above 100%: The property is generating at least as much income as originally expected.
- 90% to 100%: Performance has softened but generally remains close to underwriting assumptions.
- Below 90%: Property income has declined materially from expectations and may warrant closer review.
NOI versus underwriting shows whether a property's operating performance still supports the assumptions used when the loan was originated. Persistent declines often precede refinancing challenges and payment stress, but first determine whether underwriting assumed current income or future stabilized performance.
Delinquency Rate
Delinquency measures the percentage of loans behind on scheduled payments.
How to calculate it
Delinquency Rate = Balance 30+ Days Past Due ÷ Total Pool Balance
How to interpret it
- Lower than the broader CMBS market: Generally indicates stronger collateral performance.
- In line with market averages: Performance is consistent with prevailing market conditions.
- Significantly above market: May signal elevated credit risk or property-type-specific weakness.
Delinquency reflects realized payment problems rather than projected credit risk. Compare a pool's delinquency rate with broader market averages, and remember that many recent delinquencies have resulted from refinancing failures rather than deteriorating property performance.
Special Servicing Rate
Special servicing measures the share of loans transferred to workout specialists.
How to calculate it
Special Servicing Rate = Balance in Special Servicing ÷ Total Pool Balance
How to interpret it
- Lower rates: Fewer loans require active intervention.
- Higher rates: A larger share of the collateral is experiencing or is expected to experience credit stress.
Special servicing often provides an earlier indication of credit deterioration than delinquency because loans can transfer to workout while borrowers remain current on payments. A performing loan entering special servicing is often an early warning that refinancing or maturity issues are developing.
Loss Position in the Capital Structure
Strong collateral does not automatically create a safe bond. Where a bond sits within the capital structure determines how much protection it has against collateral losses.
Subordination
Subordination measures how much of the capital structure absorbs losses before a given bond is affected.
How to calculate it
Subordination = Balance of All Junior Tranches ÷ Total Deal Balance
How to interpret it
- Higher subordination: Greater protection because more junior bonds absorb losses first.
- Lower subordination: Less protection before losses begin affecting the tranche.
- Increasing subordination over time: Senior bonds generally become better protected as principal is repaid.
Subordination determines how much protection a bond has before collateral losses reach its position in the capital structure. It should always be evaluated alongside expected collateral losses, since a high level of subordination offers little protection if the underlying loan pool experiences severe stress.
Refinancing Risk
Most CMBS loans repay their principal with a balloon payment at maturity rather than gradual amortization. A property can perform well for years yet still default if it cannot refinance.
Exit Debt Yield
Exit debt yield estimates whether a loan could qualify for refinancing using today's lending standards.
How to calculate it
Exit Debt Yield = Current Stabilized NOI ÷ Loan Balance at Maturity
How to interpret it
- Below lender requirements: The borrower may need to contribute additional equity, negotiate a loan extension, or refinance a smaller balance.
- At or above lender requirements: The loan is more likely to qualify for refinancing under current market conditions.
Exit debt yield estimates whether a loan could qualify for refinancing under today's lending standards, making it one of the most useful measures of maturity risk. Base the calculation on current property income rather than optimistic projections to avoid overstating refinancing capacity.
Spread and Relative Value
Credit analysis determines whether a bond is likely to perform. Spread analysis determines whether the market is offering enough compensation for taking that risk.
Spread measures the additional yield investors receive over a benchmark, while relative value compares that spread with similar securities to identify attractive opportunities.
How to interpret it
- Tighter spreads: Investors perceive lower risk or are willing to accept a lower return because demand for the bond is strong.
- Wider spreads: Investors require greater compensation for perceived risk, weaker liquidity, or uncertainty in the commercial real estate market.
Spread and relative value help investors determine whether a bond's expected return justifies its level of risk. A wider spread can signal an attractive opportunity, but it can also reflect weaker collateral, lower liquidity, or changing market sentiment. Compare bonds with similar collateral, tranche positions, property types, durations, and vintages rather than relying on headline yield alone. The goal is not to find the highest spread, but the security offering the strongest risk-adjusted value relative to comparable investments.
CMBS vs. CLO Analysis
CMBS and CLOs are both structured credit securities, but investors analyze them differently because their underlying collateral and risk sources differ.
CMBS analysis starts with the commercial real estate securing the loans. Investors assess whether each property generates enough income to support its debt, how conservatively the loan was underwritten, and whether the borrower is likely to refinance at maturity. Metrics such as DSCR, LTV, debt yield, NOI, lease rollover, and subordination help investors evaluate both the underlying collateral and the bond's protection against potential losses.
CLO analysis starts with the corporate loans in the portfolio. Investors evaluate borrower credit quality, portfolio diversification, and the collateral manager's ability to trade and manage those loans over time. Because most CLOs are actively managed, the manager's decisions and track record factor into the analysis alongside the performance of the underlying borrowers.
The information available to investors also differs. Loans held in CLOs often have rating agency ratings, such as those assigned by S&P Global Ratings, Moody's, or Fitch, as well as observable secondary-market loan prices. CLO investors can monitor changes in these ratings and prices for signs that credit risk within the portfolio is increasing or decreasing.
Commercial real estate loans underlying CMBS generally do not have the same loan-level ratings or observable market prices. Investors therefore need to monitor changes in the operating performance of the properties themselves to maintain an adequate understanding of the loans those properties back. Changes in NOI, occupancy, rents, expenses, lease rollover, or property value can provide important information about whether a borrower's ability to service or refinance its debt is improving or deteriorating.
Despite these differences, the objective is similar. Investors in both markets assess collateral quality, structural protection, and relative value to determine whether a bond adequately compensates them for its risk. CMBS analysis asks whether the underlying properties can continue supporting their loans, while CLO analysis asks whether the corporate borrowers and the collateral manager can continue supporting the structure.
Bringing the Analysis Together
Effective CMBS analysis combines collateral quality, operating performance, capital structure, refinancing capacity, and market pricing into a single investment view. No single metric determines whether a bond is attractive; investors reach better decisions by understanding how each measure contributes to the overall credit picture.
That process becomes significantly more efficient when loan-level data, cash flow models, pricing, and portfolio exposures are available in one place with the latest loan performance data
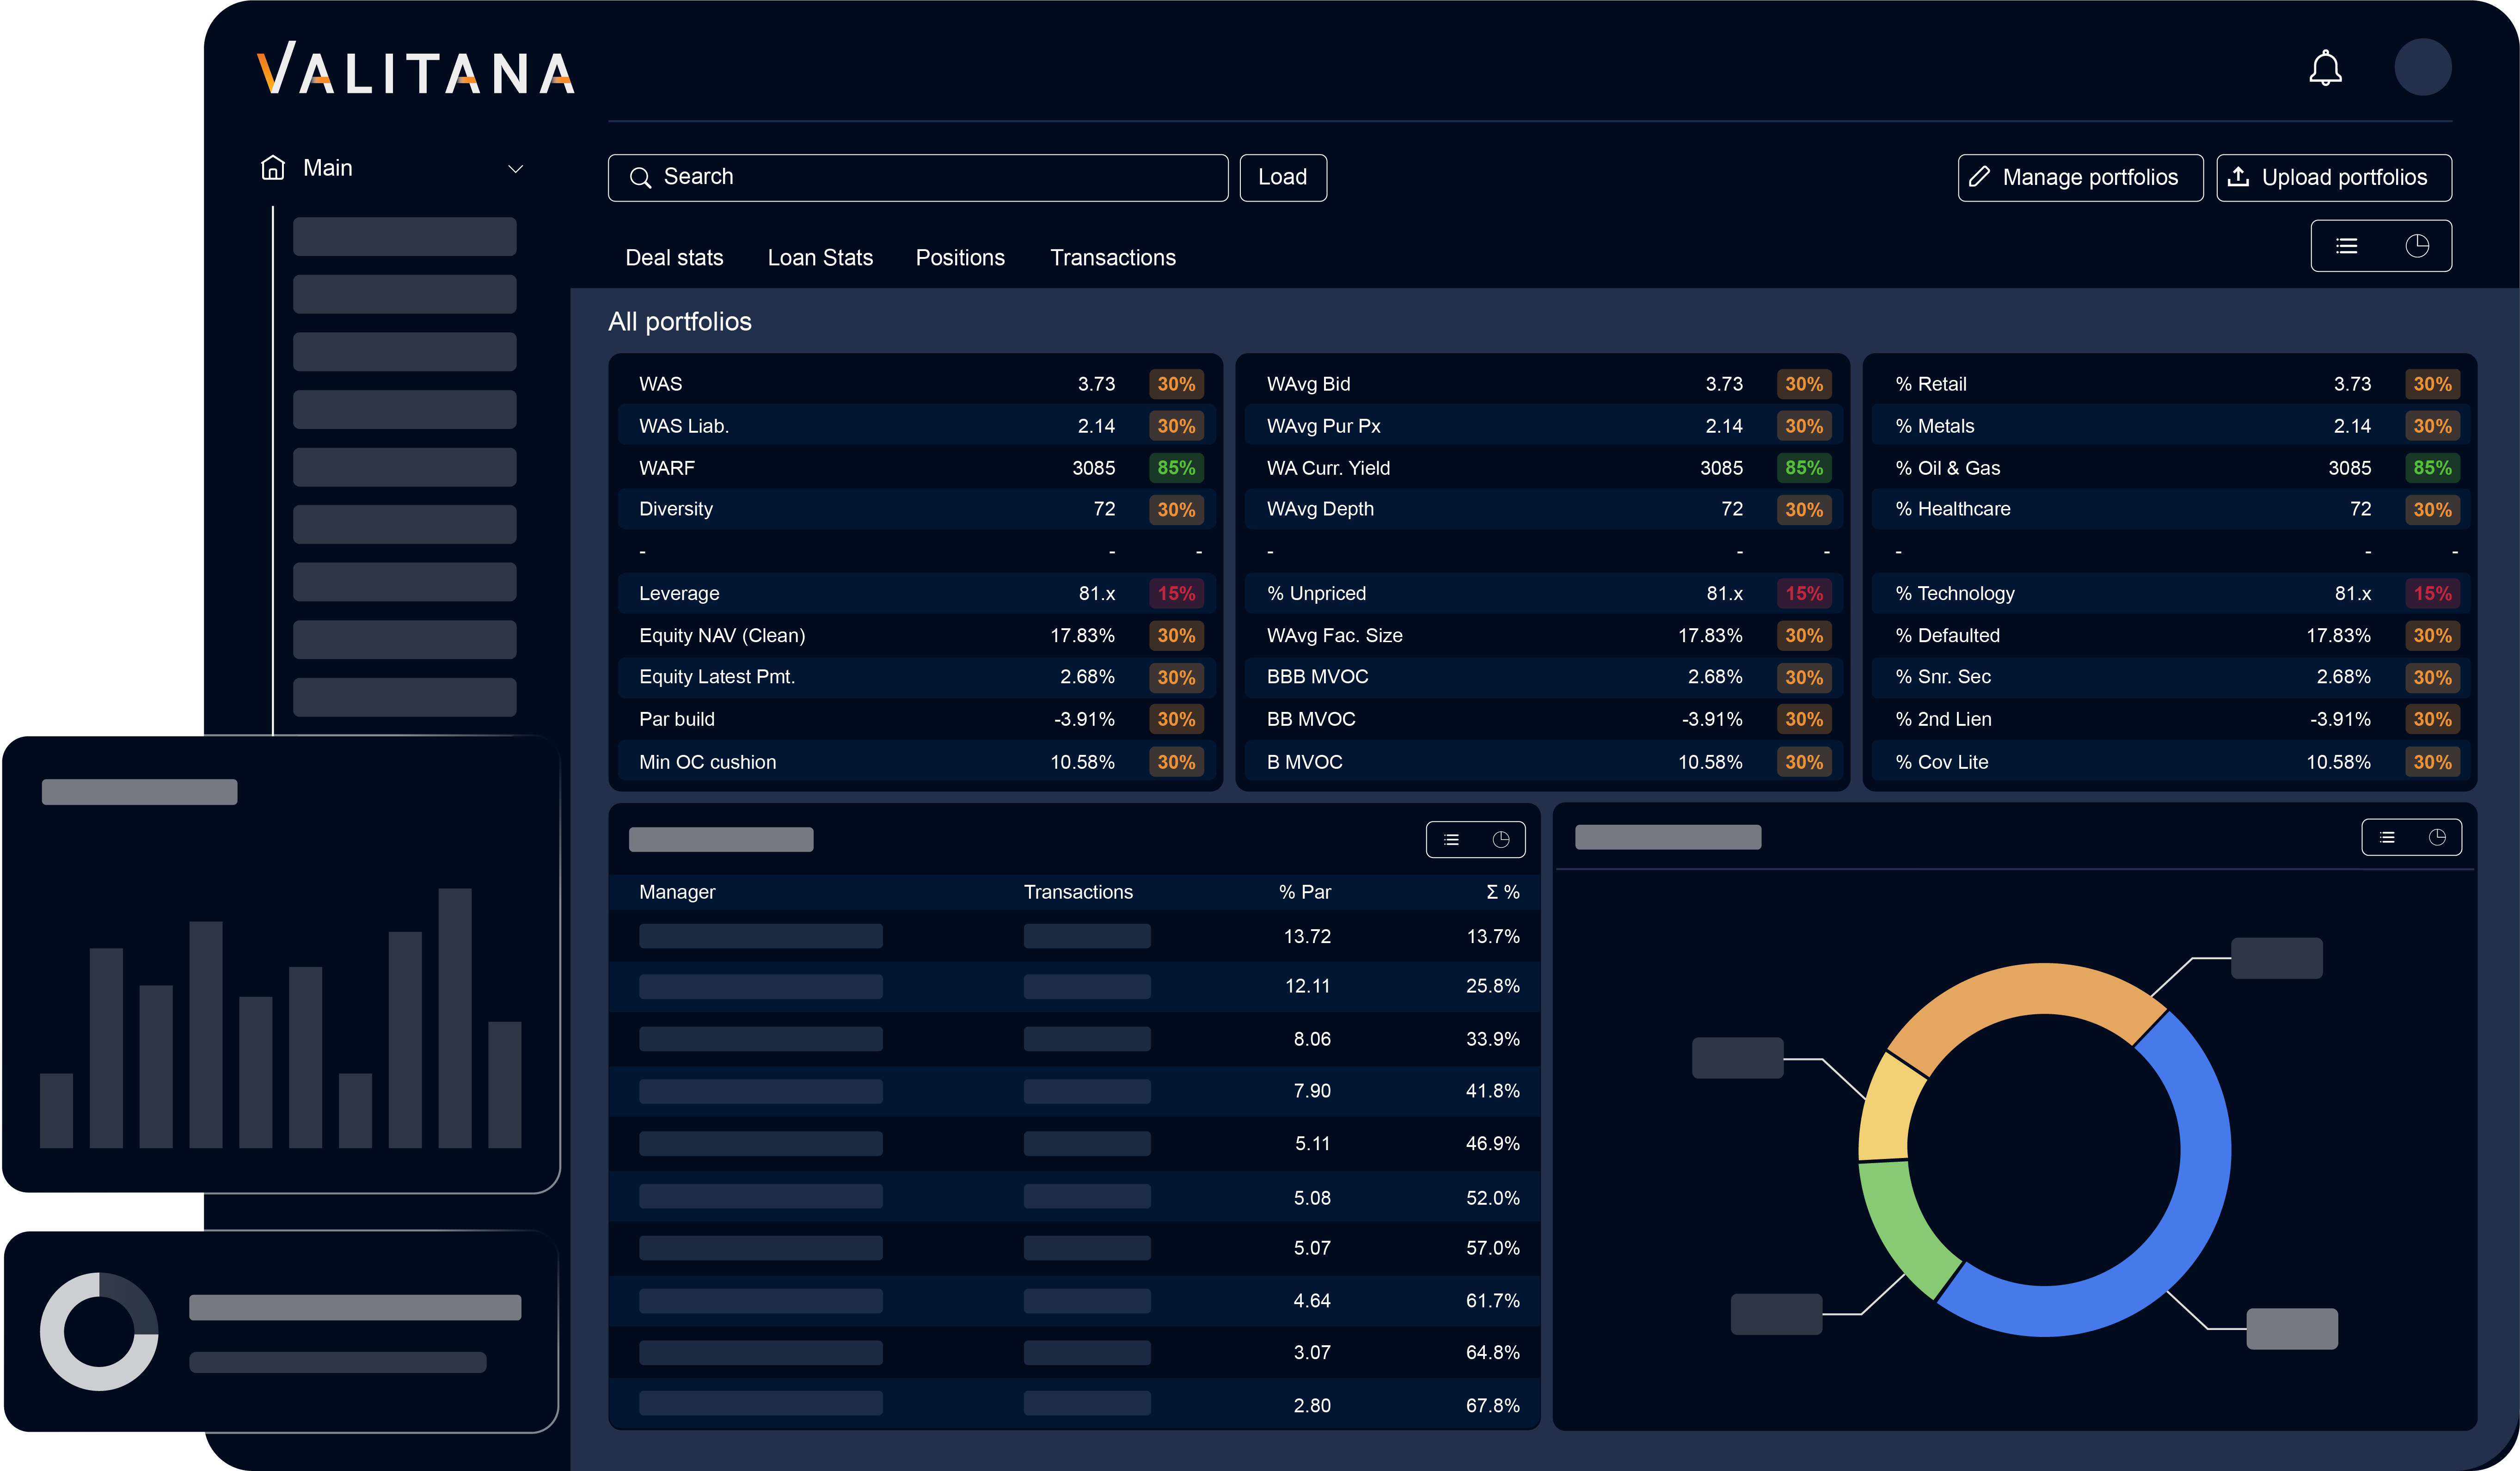
Valitana Analytics gives structured credit investors loan-level transparency across CMBS and CRE CLO transactions, real-time scenario analysis, and customizable analytics through a native Excel plugin.
See how Valitana Analytics supports institutional CMBS analysis. Schedule an Analytics Demo.
Get started with Valitana
Schedule a demo to see how Valitana can help your team. Or contact us by email at sales@valitana.com.