CLO Investment Strategy: A Practical Guide for Investors
The CLO market has grown to $1.5 trillion, drawing a broad base of institutional investors, including insurance companies, pension funds, hedge funds, and family offices, who now hold CLOs as a deliberate allocation. As more sophisticated capital competes for the same deals, the difference between average and above-average returns increasingly comes down to execution.
This article covers both the case for CLOs and a framework for building a CLO investment strategy that captures the premium returned by the asset class.
CLO Investment Strategy Structural Advantages
CLOs offer four structural advantages that are difficult to replicate elsewhere in fixed income:
- CLOs pay more than corporate bonds at the same rating. As of January 31, 2026, BBB CLOs had a yield to maturity at ~8.8% 6, compared to BBB corporate bonds with a yield to maturity at ~5.0%; a 380 basis point difference. This premium reflects structural complexity, lower liquidity, and the need for deal-level analysis of collateral, managers, and protections within each CLO.
- CLOs have lost remarkably little capital throughout history. No AAA CLO has ever defaulted in the US market. No BBB CLO issued after 2010 has defaulted as of September 30, 2025. Even including pre-crisis vintages, cumulative 10-year loss rates for BBB CLOs sit at approximately 0.58%, a fraction of what corporate bonds at the same rating have historically lost.
- CLOs offer protection against rising rates. CLO tranche coupons are floating; the majority of US BSL use 3m SOFR as the floating rate index. When rates rise, interest cash flows to the floating CLO bonds rise. Whereas fixed-rate bondholders face the opposite: their prices fall as new bonds come to market at higher yields. With an average interest rate duration of approximately 0.25 years, CLOs carry minimal price sensitivity to rate moves, though credit spreads and collateral performance still matter.
- CLOs are not in the Bloomberg US Aggregate Bond Index and carry low correlation to rate-driven assets. Adding them introduces a return stream that moves to its own rhythm, reducing overall portfolio sensitivity to interest rate movements.
Now that we’ve looked at why they belong in institutional portfolios, here is an example of a CLO investment strategy.
Tranche Selection
Every CLO allocation begins with one decision: where in the capital structure do you want to sit? The table below maps each tranche across the metrics that matter most.
*A tranche yield is a directional estimate based on interpolation between verified AA (SOFR + 153 bps, Deutsche Bank October 2025) and BBB (8.8%, BlackRock January 31, 2026) figures. No directly stated current yield figure is available from a publicly accessible source.
Questions to Ask Yourself
Before reviewing any deal, answer three questions:
What is your return target?
Mid- to high-single-digit targets point to mezzanine. Capital preservation points to AAA.
What are your liquidity requirements?
Senior tranches offer the most flexibility. AAA and AA have the most active secondary markets. CLO equity locks you in for a minimum two-year non-call period, and secondary market execution after that typically requires price concessions. If you need capital available within two to three years, senior or mezzanine tranches are the right fit.
What risks are you actually taking?
- AAA: Spread widening is your primary risk, not default. The structure absorbs losses from below before reaching you. Returns flow from steady floating-rate income.
- BBB: Your outcome depends on how precisely the deal is constructed and how skillfully it is managed. If the loan portfolio weakens, the structure diverts cash upward, temporarily cutting off interest payments to BBB holders.
- Equity: You sit at the bottom of the waterfall and absorb the full force of any underperformance. Distributions can be substantial in strong vintage years, though, and stop entirely when conditions turn.
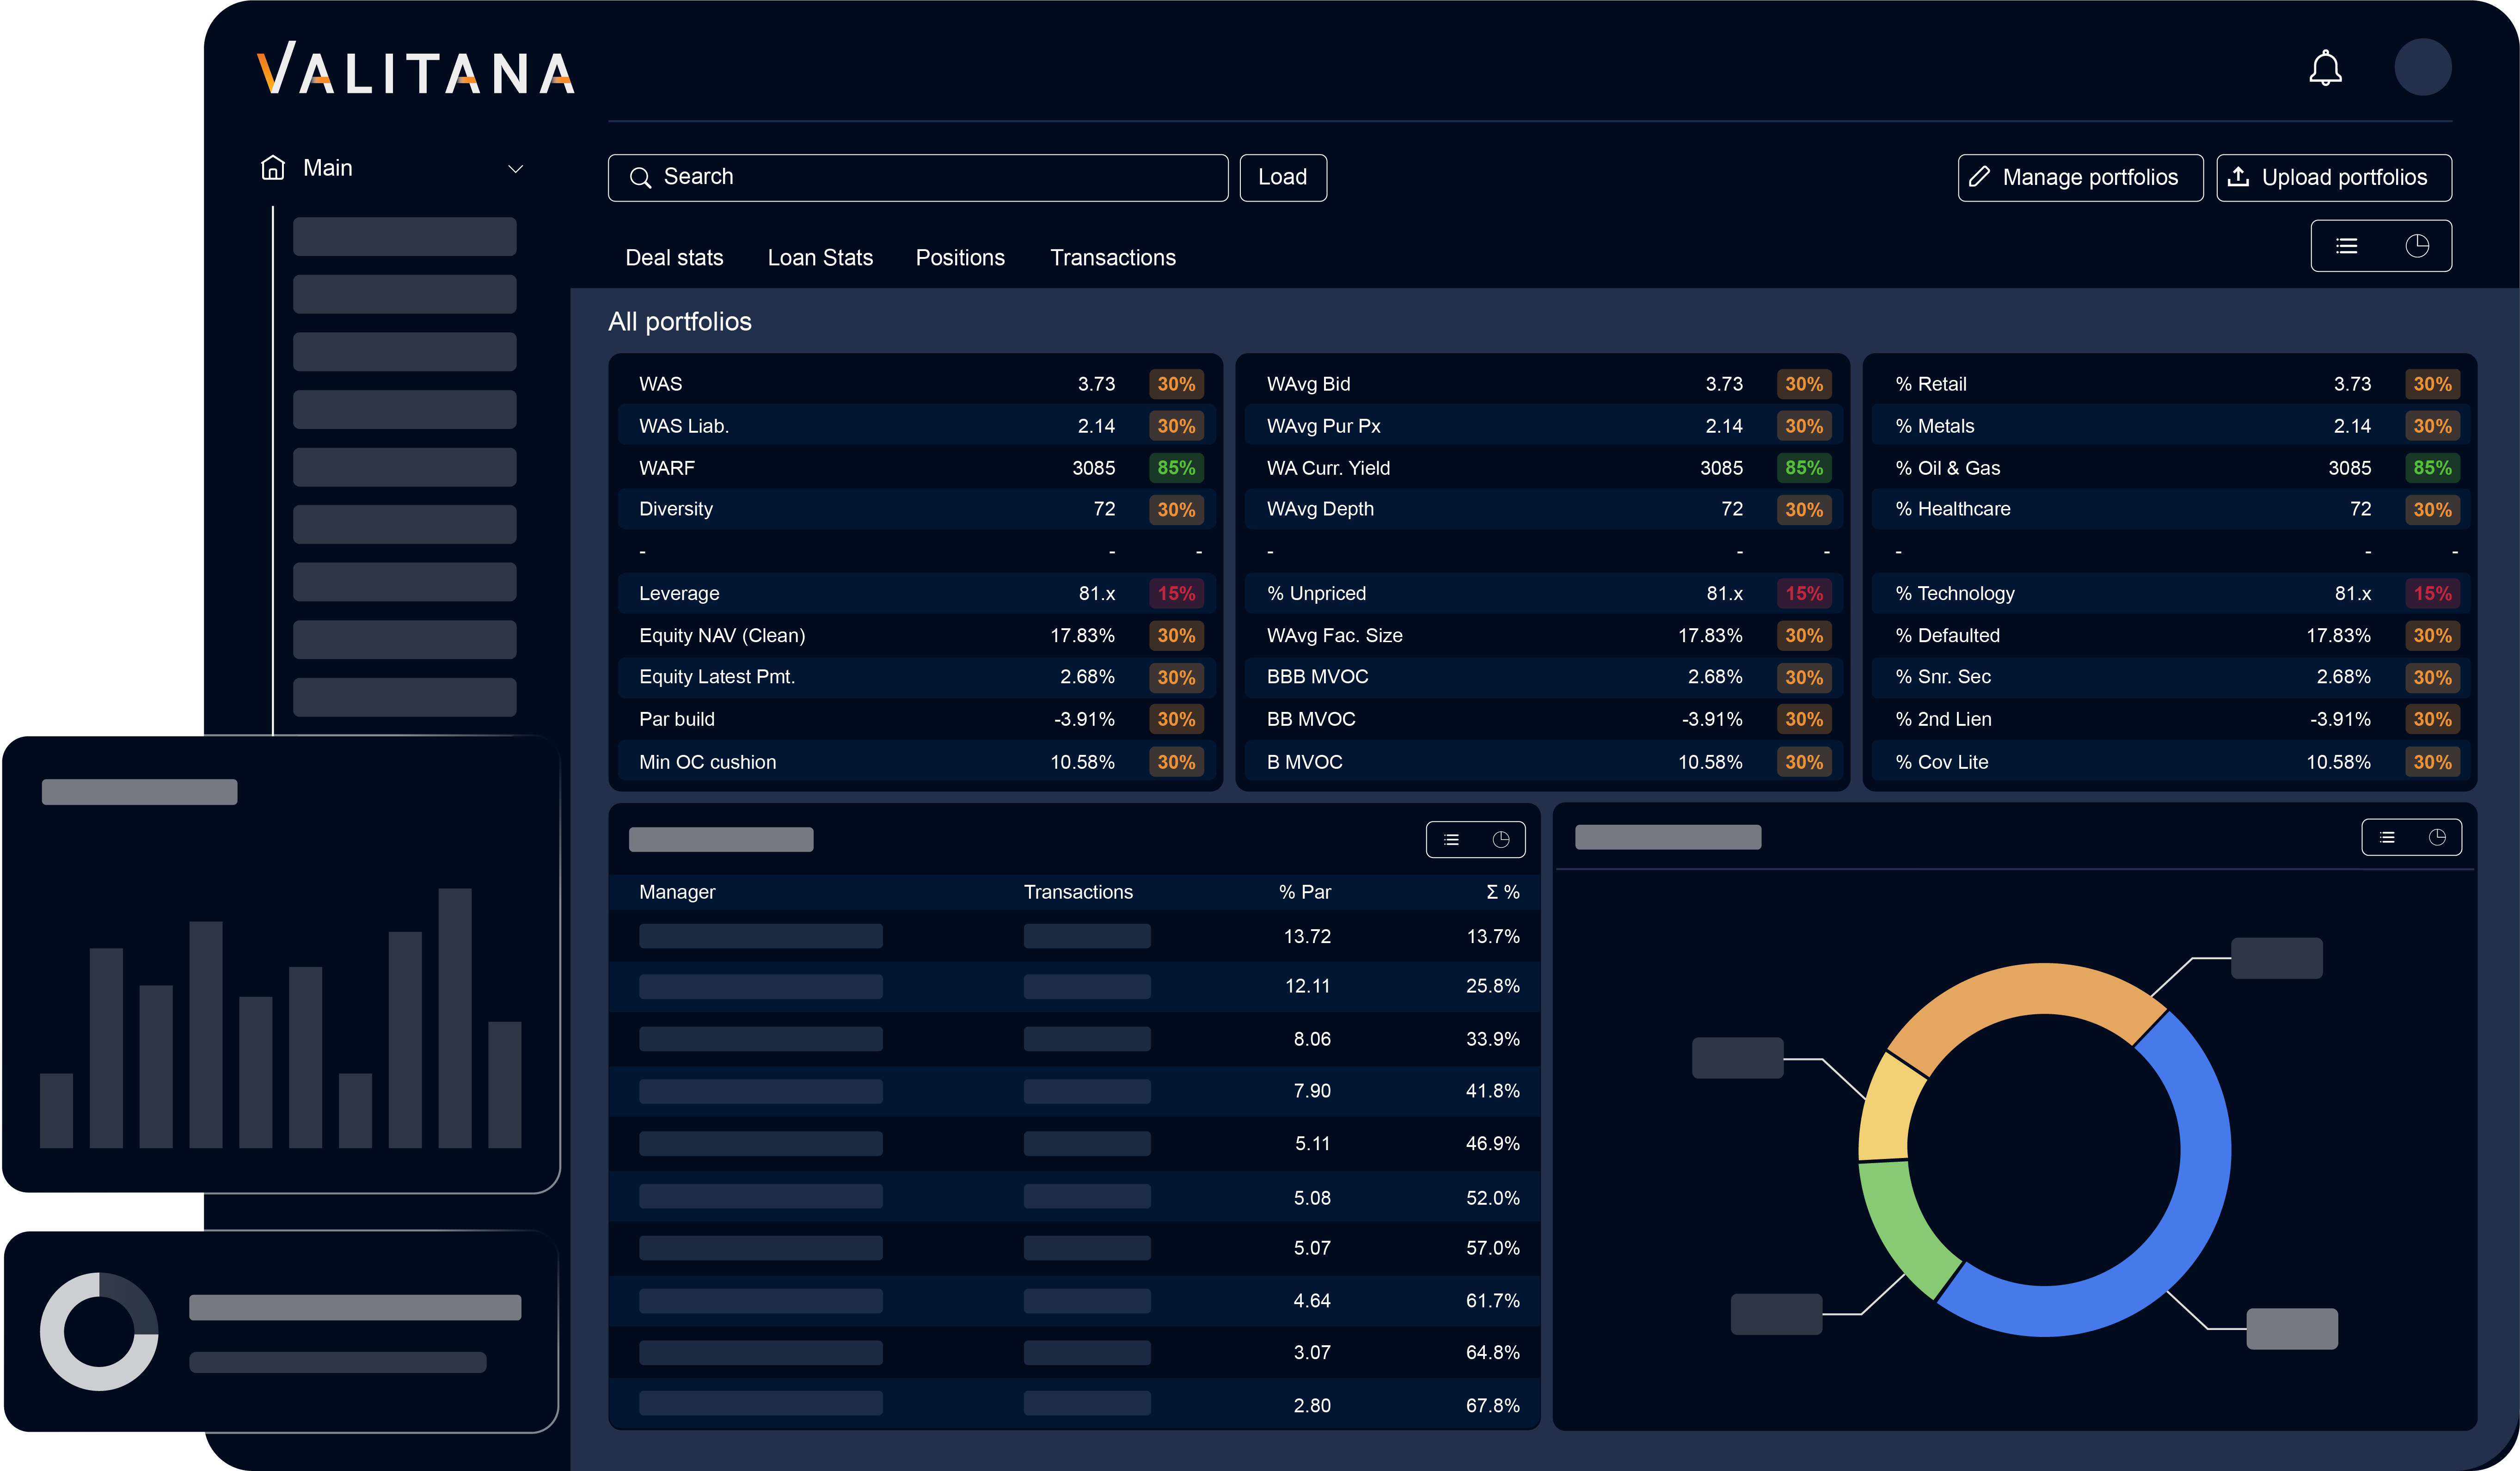
Valitana Analytics supports tranche selection by giving investors a clear, deal-level view of risk and relative value across the CLO universe. Instead of relying on ratings or static models, users can compare spreads, OC cushions, collateral quality, and manager performance across thousands of deals in real time. This allows investors to identify where pricing is justified, where it is not, and how different tranches are likely to perform under changing market conditions.
Once the appropriate tranche is identified, manager evaluation becomes the primary driver of outcomes.
Manager Evaluation
Unlike a corporate bond, a CLO is an actively managed portfolio. The manager decides which loans to buy, hold, and sell throughout the reinvestment period, and those decisions directly determine whether your tranche performs as expected.
Here is what to look for:
- Track record across multiple vintages. Look for consistent above-median returns across both favorable and stress periods. How a manager performed in 2008 and 2020 is more revealing than any recent result.
- CCC concentration. Managers who consistently keep CCC-rated collateral below 4% while sustaining returns are exercising genuine credit discipline. The market average as of March 2026 is 5.01% and rising.
- Trading behavior under stress. Managers who buy discounted loans when prices fall historically produce the strongest stress vintage returns. Passive holders of deteriorating positions do not.
- Secondary market presence. Managers with greater secondary market visibility command better pricing on new deals. The top 15% of managers by secondary market visibility capture 50% of total secondary market activity and achieve AAA pricing that is 2 to 4 basis points tighter than competitors', directly reducing the cost of debt and improving equity distributions.
Valitana’s manager performance analysis tools allow investors to quickly track these metrics and more across 130+ active CLO managers in real time.
Vintage Timing
Selecting the right CLO tranche for the right CLO manager still leaves one critical variable: when to invest. In CLO equity, vintage timing is one of the strongest predictors of outcome.
- Enter during dislocations. The 2007 and 2020 vintages delivered median IRRs of 21% and 17% because managers could acquire discounted collateral and lock in wide spreads. Falling loan prices and widening spreads are historically the most attractive entry signals.
- Be cautious in tight markets. The 2021 vintage delivered just 7.8%, with the bottom quartile as low as 3.0%. Loan spreads currently sit at the 10th percentile of historical levels. New equity commitments require careful deal-level underwriting.
- Prioritize resets over new issuance in 2026. BofA forecasts $405 billion in resets and refinancings this year. For existing equity holders, resetting at lower liability spreads directly expands the arbitrage and increases distributions.
Valitana's CLO valuation tools allow investors to model the precise scenario assumptions across default (CDR), recovery, and prepayment (CPR), helping teams stress-test entry conditions before committing capital to a CLO investment.. Avoiding CLO landmines is necessary, especially at the bottom of the cap stack.
Three Portfolio Approaches
Most institutional CLO portfolios follow one of three frameworks, based on their return target, risk tolerance, and the team’s analytical capability.
Anchor and Enhance
Start with AAA for stable, floating-rate income and capital preservation. Add selective BBB or single-A positions to increase yield where the deal quality supports it.
AAA provides the foundation. Mezzanine positions add income without taking on equity-level risk.
Best for: Insurance companies, banks, and conservative asset managers operating within strict quality constraints.
Barbell
Combine AAA and equity, skipping mezzanine entirely.
AAA provides stability and consistent income, while equity targets higher, more variable returns.
Best for: Hedge funds and family offices that can tolerate equity volatility and limited liquidity.
Full Stack
Allocate across AAA, mezzanine, and equity, adjusting exposure as market conditions change.
Add mezzanine when pricing becomes attractive. Increase equity exposure when return conditions improve. Lean on AAA when new deals offer limited value.
This approach requires active monitoring across the capital structure.
Best for: Sophisticated asset managers and multi-strategy funds with the ability to manage all three tiers.
Execute Your CLO Investment Strategy With Valitana
What separates strong CLO portfolios from average ones is execution. Tranche selection, manager evaluation, and a deep-dive analysis on the deal and its underlying collateral each demand analytical precision that generic tools cannot support.
The edge in CLO investment strategy comes from analytical depth. Valitana Analytics gives institutional investors the deal-level analysis, manager evaluation tools, scenario modeling, and real-time market data to execute with that precision across every tranche and every market condition.
Book a demo to see Valitana Analytics in action.
This article is for informational purposes only and does not constitute investment advice, a solicitation, or a recommendation to buy or sell any security or financial instrument. The information contained herein is not intended to be a source of advice or credit analysis with respect to the material presented. The views expressed are those of the author and do not constitute financial, legal, or tax advice. Investing involves risk, including the possible loss of principal. Past performance is not indicative of future results. Readers should conduct their own research and consult with a qualified financial advisor, attorney, or tax professional before making any investment decisions. The author is not a registered investment advisor.
Get started with Valitana
Schedule a demo to see how Valitana can help your team. Or contact us by email at sales@valitana.com.