CLO Market Trends 2026: Growth, Tighter Arbitrage, and Shifting Credit Stress
The CLO market continued to expand in 2026, but that growth came alongside tighter deal economics and lingering stress in weaker credits. Europe added CLOs at a faster pace than the US, while limited loan supply kept pressure on asset spreads. Loan prices recovered from their first-quarter lows, but lower-quality credits continued to lag the broader market.
This CLO market trends analysis examines each shift using Valitana CLO data through June 30, 2026, supplemented with broader US leveraged-loan market data through August.
CLO Market Trends at a Glance
This year-over-year comparison highlights the CLO market trends shaping US BSL and European CLOs, including where the two markets moved together and where their paths began to diverge.
Source: Valitana, 2026 Q2 Quarter in Review CLO Report. Percentage changes and spread differentials calculated from reported figures.
1. Europe Is Growing Faster From a Smaller CLO Base
The US remained the larger CLO market through Q2 2026. Valitana recorded 65 US BSL deals totaling $30.52 billion in collateral par during the quarter, compared with 31 European CLOs totaling $13.20 billion.
Europe is growing faster on a percentage basis. Its outstanding deal count and collateral par both increased at roughly twice the US rate year over year.
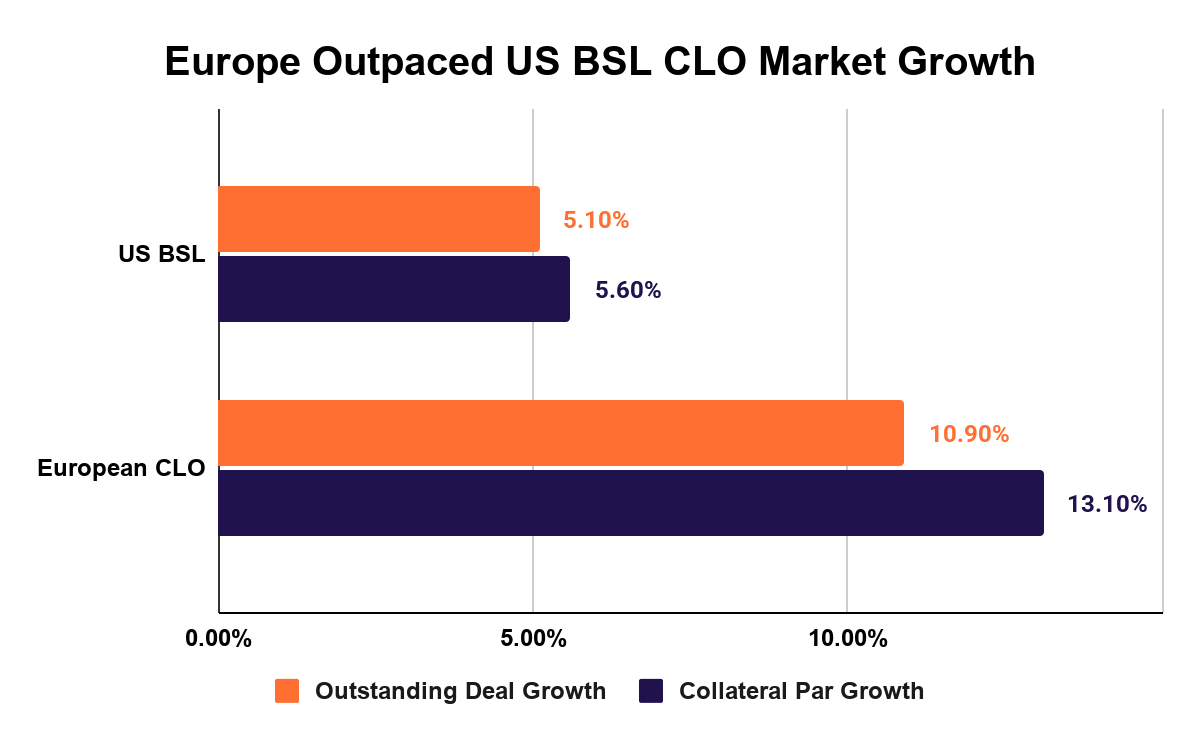
Part of that difference comes from scale: Europe’s CLO market starts from a much smaller base, so each new deal produces a larger percentage increase. Market conditions also helped. S&P Global Ratings cited tight spreads, steady demand for higher-quality CLO paper, low defaults, and a growing investor base as factors supporting issuance in 2026.
Quarterly issuance has been less consistent. AFME reported €14.9 billion of placed Pan-European CLO issuance in Q2 2026, down from €16.0 billion in Q1. The year-over-year expansion therefore reflects a larger outstanding market, not steadily accelerating issuance from quarter to quarter.
Looking Ahead: What Could Sustain or Slow Issuance
The next variable is collateral supply. S&P expects refinancing and M&A-related loan issuance to continue feeding European deals. In the US, limited new loan supply could keep CLO formation below the record pace set in 2025 unless M&A and LBO activity adds more collateral for managers to buy.
Investor Takeaway
Issuance totals alone do not show how attractive individual deals are. Investors still need to compare managers, collateral pools, pricing, and structures across the two markets. Valitana Analytics supports that comparison through manager analysis and loan-level look-through to underlying obligors and facilities.
2. Asset Spreads Are Compressing Faster Than Funding Costs
The gap between what CLOs earn on their loan collateral and what they pay on their liabilities narrowed over the year to June 2026. US BSL weighted-average asset spread fell 24 basis points to 3.01%, while Europe declined 20 basis points to 3.56%. Funding costs moved less in the US and in the opposite direction in Europe: US liability spreads fell 18 basis points to 1.71%, while European liability spreads rose 4 basis points to 1.98%.
That reduced the simple asset-liability spread differential from 136 to 130 basis points in US BSL and from 182 to 158 basis points in Europe. In other words, the income available on the asset side compressed more than the cost of financing those assets.
Much of that pressure traces back to the loan market. Strong demand from CLO managers and other loan investors has competed for a limited supply of new loans. When more buyers compete for the same collateral, borrowers can issue debt at tighter spreads, which leaves CLOs earning less on newly purchased loans. Voya described CLO arbitrage as challenged by tight underlying loan spreads in August, even as managers continued bringing new deals to market.
The simple spread differential is only a rough measure of CLO economics. It does not account for leverage, fees, hedging, deal structure, collateral losses, or other factors that affect equity returns.
Europe also requires a distinction between the outstanding market and new issuance. The 1.98% liability spread above reflects the existing market. New European deals were also averaging 1.98% in June 2026, down from 2.11% a year earlier, so funding for newly issued deals had become cheaper even as the average liability spread across outstanding deals moved higher.
Looking Ahead: Loan Supply Will Determine How Long the Pressure Lasts
A pickup in M&A and LBO issuance could give CLO managers a larger pool of new loans to buy and ease some of the competition for collateral. If loan supply remains limited while CLO demand stays strong, asset spreads could stay compressed and keep pressure on the gap between asset income and funding costs.
Investor Takeaway
Issuance volume alone does not show how attractive an individual deal’s economics are. Valitana Analytics lets investors compare asset and liability spreads by deal and manager, then run cash flow projections under different reinvestment and credit assumptions.
3. Loan Price Stress Peaked Early in 2026, Then Eased
On a year-over-year basis, discounted collateral still looked elevated in June. US BSL collateral trading below 90 increased from 8.18% in June 2025 to 11.54% in June 2026, while Europe rose from 6.34% to 10.43%.
The monthly data show that the worst of the repricing came earlier in the year.
Source: Valitana, 2026 Q2 Quarter in Review CLO Report
By June, US below-90 exposure was 219 basis points below its February peak, while Europe was 495 basis points below its March peak. Below-90 exposure remained above June 2025 levels, but had retreated substantially from its first-quarter peak.
One source of the early repricing was the software sector. Software loans sold off sharply in the first quarter as investors questioned the durability of traditional business models in the face of AI. Because the sector represents a sizable share of leveraged loan collateral, that weakness contributed to the increase in discounted loans across CLO portfolios.
Pricing remained under pressure late in the first half. S&P reported that average sector loan bids fell 140 basis points during June to 87.31. The broader loan market strengthened after quarter-end, with the Morningstar LSTA US Leveraged Loan Index average bid rising 21 basis points to 95.17 in July and another 41 basis points to 95.58 in August.
Looking Ahead: Can the Price Recovery Hold?
The recovery continued into the third quarter, but loan prices had not fully retraced the earlier decline. The next signal to watch is whether the share of collateral trading below 90 continues to fall. A sustained decline would indicate that the rebound is reaching more of the loan market, while another increase would suggest that discounted collateral is beginning to build again.
Investor Takeaway
A market-level price series shows when conditions change, but not which borrowers are responsible. Valitana Analytics traces weaker bids to individual obligors and facilities, compares those exposures across CLOs, and lets investors test how further deterioration could affect projected tranche cash flows.
4. Credit Stress Remains Concentrated
Broad credit measures were fairly stable through the first half of 2026. US BSL WARF improved from 2,783 to 2,703, while defaulted collateral fell from 0.48% to 0.32%. Europe showed a similar pattern, with WARF declining from 2,916 to 2,890 and defaulted collateral from 0.81% to 0.41%.
The weaker end of the market did not improve as much. S&P reported that the CCC bucket in its US BSL CLO Insights Index reached roughly 5% by late June. Valitana’s separate measure of collateral rated below CCC+ fell from 5.03% to 4.26% in US BSL, while Europe edged up from 2.71% to 2.82%. These measures use different rating thresholds, so they are not directly comparable.
The clearest sign of stress showed up in loan prices. CCC-rated loans remained negative in August even as the broader US leveraged-loan bid increased 41 basis points. In other words, the broader market was recovering, but the weakest credits were still lagging.
Looking Ahead: Rating Migration and the 2028 Maturity Picture
The next question is whether that stress stays confined to weaker borrowers. Rating migration among CCC and B-minus credits can show whether problems are spreading more broadly through CLO collateral.
Refinancing needs also become more relevant as 2028 approaches. Valitana reports that only 1.85% of US BSL collateral matures before 2028, compared with 13.33% during 2028. That limits the immediate maturity burden, but borrowers already trading at discounts could face more difficulty refinancing if credit conditions weaken before those maturities arrive.
Investor Takeaway
Portfolio averages can obscure problems concentrated in individual borrowers or sectors. Valitana Analytics shows where those exposures sit across CLOs and managers, while Vantage lets teams examine concentrations within a specific portfolio, test hypothetical trades, and check compliance requirements before adding exposure.
What 2026 CLO Market Trends Mean for Investors
The CLO market trends taking shape in 2026 are giving investors more to weigh at the deal and portfolio level. Issuance continues to expand, but new loan supply has not kept pace with CLO demand. Credit metrics remain relatively stable even as weaker borrowers and lower-rated credits account for more of the pressure in certain parts of the market.
That makes broad averages less useful on their own. Investors increasingly need to know which obligors are behind weaker prices, where those exposures appear across CLOs, how managers differ, and what happens to tranche cash flows if conditions change.
Valitana Analytics brings those questions into the same analytical workflow through loan-level look-through, manager and deal comparison, BWIC analysis, cash flow projections, and scenario testing. Vantage carries that analysis into portfolio decisions by showing current exposures, testing hypothetical trades, and monitoring concentration and compliance requirements.
As 2026 progresses, the opportunity will depend less on calling the market correctly and more on identifying where pricing, credit quality, and portfolio exposure diverge.
Explore Valitana Analytics | Explore Valitana Vantage
Get started with Valitana
Schedule a demo to see how Valitana can help your team. Or contact us by email at sales@valitana.com.